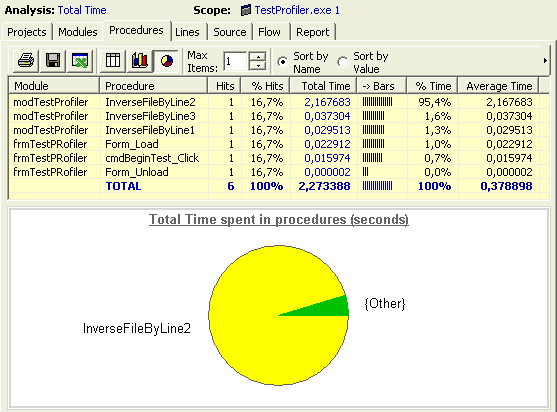
The purpose of this guided tour is to show you how to use the VB Watch Profiler for finding out where the slow code of a sample project is, and to determine which are the lines that were never executed.
1. Open the Profiler: menu Start / Programs / VB Watch 2 / VB Watch Profiler.
2. Click the Options button and make sure the Full profiling plan is selected.
3. Now click the Profile Project... button on the left and browse for \Program Files\VB Watch 2\Samples\VB6\Profiler Sample\TestProfiler.vbp.
4. When prompted, click the Select all and go button. After instrumentation, the sample loads: click the Start Test button and once done, close the application.
5. The session is automatically loaded in the profiler. The project's components appear in the tree view in the left pane. Expand all the colored branches.
Modules and procedures are colored from red (slowest) to green (fastest). You can see instantly where the slow code is. Legend:
LC = Line coverage (number of lines executed / total number of lines)
TT = Total time
AT = Average time (procedures only)
6. How to detect slow code
In the toolbar, check the Display total time button. Select the Modules tab and make sure that the selected item in the tree view is the root node: TestProfiler.exe 1.
You can see that the module in which the most time is spent is modTestProfiler. Click on its name in the grid view. An hyperlink takes you instantly to its procedures view. You can see that the slowest procedure is InverseFileByLine2.

(This figure is not exactly what you should see)
Again, click it. You're taken to the line view, which clearly shows where the bottleneck is: in the "BuildString = ..." line.
Click this line (under the Line column exactly) to get to the source code view. Note: you may also double-click a procedure or a module to jump to the source code view).
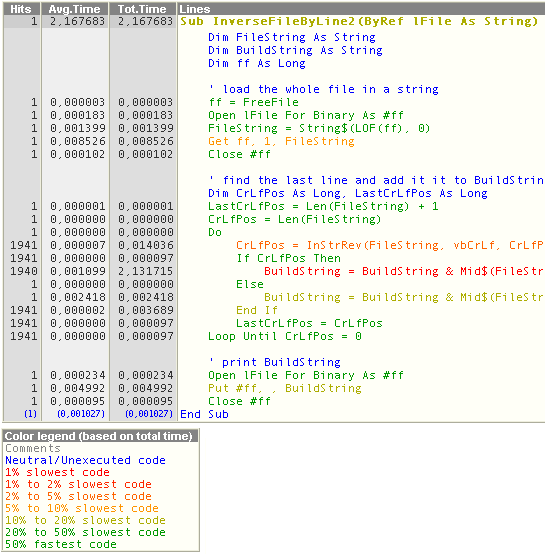
Finally, it appears that the string concatenation "BuildString = BuildString & ..." is really slow with large strings. See in InverseFileByLine3 how you can make it much faster by using the Mid$ statement.
7. How to detect untested code
The idea is still the same except that you must check the "Display coverage values" button in the toolbar.
You'll find out that the only untested line resides in the InverseFileByLine3 procedure.
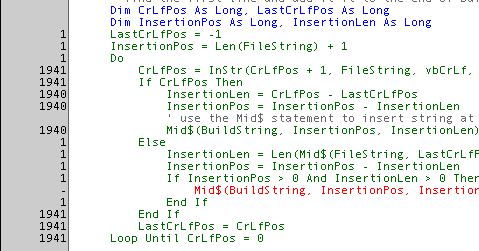
The line in red was never executed. The left margin displays the number of time each line was executed.
8. Additional notes
The tree view, the grid views and the source code view are
hyperlinked together. Click (or even double-click in the grid views)
on a module, a procedure or a code line to switch views. Use the
browsing arrows to go back or forward.
Right click on modules, procedure or lines to jump in the original source in VB and pinpoint it.
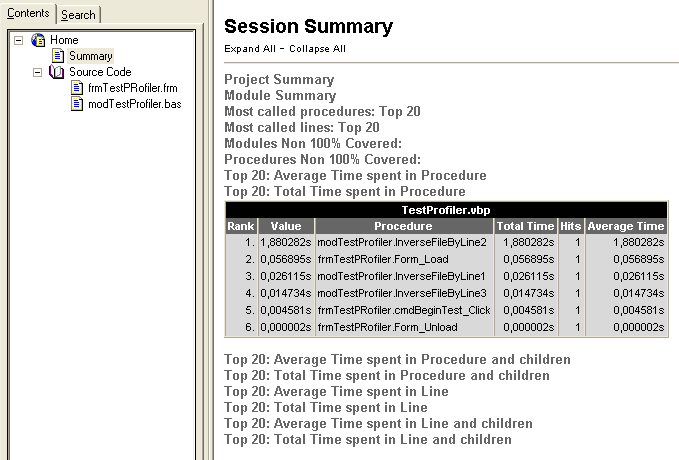
You may request a full HTML or CHM report, or export the data currently displayed in the grid to another application (such as MS Excel) by selecting the "Report" tab.
|
|
|
|
|
|
|
|
|
|
|
|
|
|
Step by step: How to profile the execution of your project on another machine |